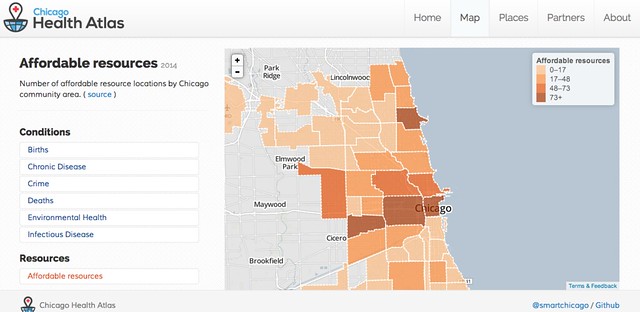
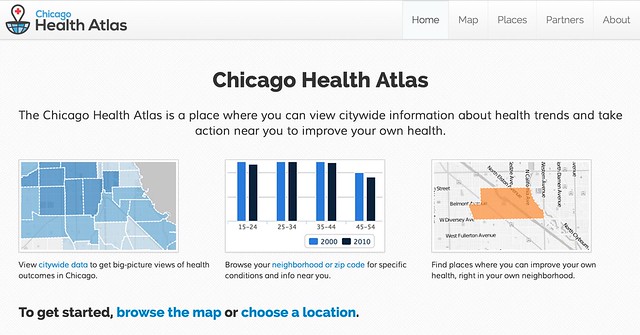
The Smart Chicago Collaborative is proud to launch our latest version of the Chicago Health Atlas. Last fall, Smart Chicago conducted user testing on the Chicago Health Atlas. Out of those results, there were several points made on what we could improve. The main one being that it was difficult to find health resources on the site. We’ve taken the feedback from the test and used it as a basis to improve the new site. Here’s a rundown of the new features:
Health Atlas
Chicago Health Atlas Data Feeds
Today we’ve added support for querying the data that appears on Chicago Health Atlas by adding JSON endpoints for the major pages. If you want to get access to the underlying data that drives our maps and charts, just add “.json” to the URL of pretty much any page and we’ve got you covered.
Examples:
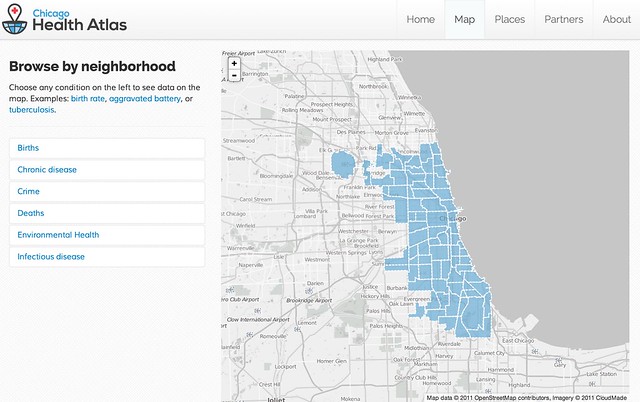
You can see all community area and zip code boundaries in Chicago by eyeballing our map:
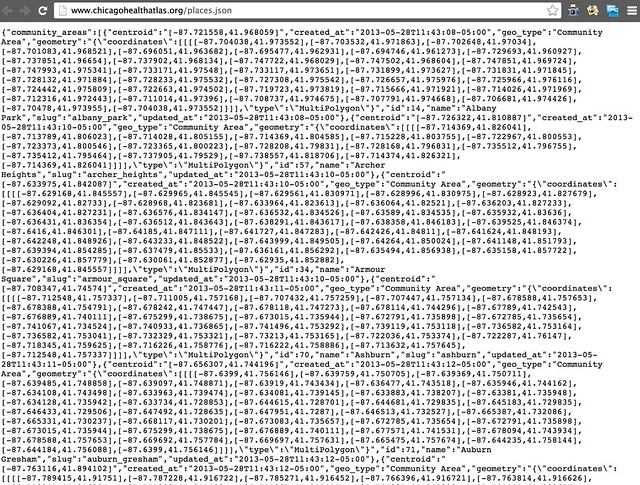
Or you can see the raw data http://www.chicagohealthatlas.org/places.json:
You can see all birth rate data by year or see the data all at once.
Birth rate data for the Loop area with confidence intervals as json.
Thanks to Dan Sinker and Cory Nissen for asking for this feature and Derek Eder for getting it done lickety-split.
@SmartChicago Awesome. I’d love to be able to ping an API and get each location’s data as a JSON chunk.
— dan sinker (@dansinker) June 18, 2013
@SmartChicago Nice, can the raw data be accessed at all, or are we limited to browsing via the map interface?
— cory nissen (@corynissen) June 18, 2013
@corynissen @smartchicago Seems like you may have just built the official one form them!
— dan sinker (@dansinker) June 19, 2013
See also Cory’s method for querying this site– thanks for doing this, Cory.
Have at it!
The Launch of Chicago Health Atlas
Today we’re happy to announce the launch of our latest project, the Chicago Health Atlas, where you can view citywide information about health trends and take action near you to improve your own health.
You can read all about the making of the Chicago Health Atlas on our project page. It’s quite a story of collaboration. We pulled sprawling amounts of city-wide health data into a cohesive view of health near you.
- It all starts with Otho S.A. Sprague Memorial Institute, the project funder, and Jim Alexander, the Institute’s Executive Director and the conceptual leader behind the project
-
We worked with Abel Kho and some of the largest providers of health care in Chicago to develop tools which balanced the need for anonymity of patients and providers, while preserving uniqueness of patients. Read more about their work here
- Eric Jones and Jamyia Clark of the Chicago Department of Public Health have been instrumental in shepherding the CDPH data into the Atlas— explaining the data, advising on presentation, and generally acting as an intermediary between the Web development and health informatics sides of the project. He also presents the project to the health science community at places like the 2013 Council of State and Territorial Epidemiologists Annual Meeting
Read more about data sources on the Chicago Health Atlas About page.
On the Smart Chicago side, Program Officer Kyla Williams oversees all of our health initiatives and has been a great leader. Long-time consultant Derek Eder of Data Made has been essential to the success of this project. His deep experience with mapping Chicago things has been a huge natural resource. Aaron Salmon of Auraworks is the design lead for this project.
Patrice Coleman is our Project Coordinator in charge of outreach. Want to take part? Let’s do it.
Chicago Health Atlas on the Github Blog
Github announced a new feature today— the visualization of geographic data— and pointed to the geojson data we store for our Chicago Health Atlas product as an example. This post has led to 240 forks and counting.
Chicago Health Atlas Presentation at AMIA 2012
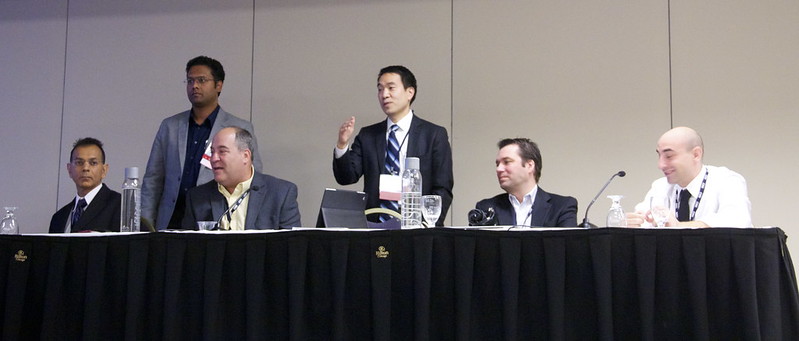
This morning Abel Kho and a number of his colleagues presented “The Chicago Health Atlas: A Public Resource to Visualize Health Conditions and Resources in Chicago” at the AMIA 2012 conference at the Conrad Hilton here in Chicago.
The talk covered a number of topics, including program design, anonymizing records, Institutional Review Board approvals, and data extractions (diagnoses, medications, and laboratory tests for all patients seen at participating institutions).
Today we also published some new data that came out of their work— diabetes rates by zip code from 2006 – 2010. Stay tuned for more data and an updated user interface on the Chicago Health Atlas in the weeks to come.