There Are No Innocents: Data Rebroadcasting and Server-Side Responsibility – Karl Fogel at OpenGov Hack Night

karlOn April 14th, Karl Fogel of Open Tech Strategies and QuestionCopyright.org presented at OpenGov Hack Night on data rebroadcasting and server-side responsibility.

Data rebroadcasting is when one datasource posts data from another source. Civic apps tend to do this all of the time. For example, clearstreets.org rebroadcasts data from the City of Chicago’s plow tracker website and chicagoflushots.org rebroadcasts data from the city data portal.

Fogel used several examples to showcase the problems that can occur when people rebroadcast data that may invade someone’s privacy or may be downright inaccurate.  The first example was Chicago Councilmatic. A resident’s name had been placed on the record after filing a dispute about a very high water charge. The resident had asked that her name be removed from the site. However, this proved difficult since the app scrapes the Chicago City Clerks’ Legistar Website and is part of the official public record. Whatever’s in the public records ends up being placed on the Councilmatic website.

Another example that Fogel used to talk about the problem of data rebroadcasting is expungement. Whenever you get your criminal record expunged, the law considers reality as you having never committed the crime in the first place. So, when you’re applying for the a job and they ask “Have you ever been convicted of a crime?” you can answer no and be legally correct.

However, if you start googling sometimes you’ll find the information about your criminal record still exists on the internet. Most infamously, there are sites that make money by posting mugshots online and charging for their removal. Additionally, news sites about the case may still come up as a top hit in a google search. Fogel used one news site as an example where the news site posted an updated disclaimer at the top of the site saying that the person charged with the crime had been exonerated – but it the site still came up high in the search results.

Fogel proposed a set of working principles when thinking about rebroadcasting data.

  • Techies are binary: Fogel points out that tech minded people can be pretty binary. The data is or isn’t available. It either is open sourced or it’s not. For people outside of tech, questions like this can have a whole range of answers. (It’s available, but it’s really hard to get.)
  • Is the info there through the subjects own actions?
  • Can you make all the important follow-up visible? If something changes (like a record being expunged or a credit report being fixed), will the changes be reflected?
  • Is there a customary legal forgetting process involved?
  • How would you feel if it were your kid?

You can watch Fogel’s presentation in full below:

Illinois Sentencing Policy Advisory Council at OpenGov Hack Night

new-logo1At this week’s OpenGov Hack Night, the Illinois Sentencing Policy Advisory Council came and spoke about their work and how they use data to advise policymakers.

SPAC was created to collect, analyze and present data from all relevant sources to more accurately determine the consequences of sentencing policy decisions and to review the effectiveness and efficiency of current sentencing policies and practices. They’re a four person team split between Chicago and Springfield that advises the Illinois Legislature on how certain laws will impact prison populations.

The criminal justice system is complicated – any change in the law could affect the prison population and the cost to the state. SPAC uses a variety of data sources to analyze the effects of new laws and let Springfield know what’s working and what’s not. While you can FOIA SPAC, SPAC doesn’t actually own any of the data that it uses – rather it consumes data from other agencies.

Here’s Research Director Nate Inglis Steinfeld introducing SPAC.

You can see SPAC’s full slide deck below. If you’d like to get involved in using technology to aid the efforts in criminal justice reform, you should check out the Safety and Justice Breakout Group at OpenGov Hack Night.

Public Lab and the Southeast Side Coalition Against Petcoke at OpenGov Hack Night

publiclab-logo-largeOn March 24th, Public Lab and the Southeast Side Coalition against Petcoke presented at Chicago’s OpenGov Hack Night about their homemade environmental monitoring kits.

Their project was in response to petcoke being dumped all over Chicago’s southeast side. Petcoke is a byproduct that oil refineries produce that’s used to as a fuel source for power plants. However, they never burn the fuel in the US because it’s illegal – instead it gets shipped overseas to burn in places without as much environmental regulation.

In Chicago, most the petcoke pollution comes in as a result of the KCBX Terminal in Indiana – which is owned by Koch Industries. Energy company BP was placing piles and piles of petcoke along the river as it was awaiting shipment. When the winds get strong, petcoke dust from uncovered shipping containers blows into southeast Chicago.

One of Olga Bautista‘s first encounters with petcoke was at a birthday party being held in a city park. A gust of wind quickly covered everyone and the birthday cake – rending the cake completely unedible. Bautista and her neighbors began to organize against petcoke in their neighborhood. To help with the effort, the Coalition worked with Public Lab to create Balloon Mapping Kits to help gather data on petcoke pollution.

The Balloon Mapping Kit was used to measure air quality on the southeast side and provide evidence of the pollution petcoke was creating.

They then put pressure on the city to pass ordinances regulating petcoke in the city. In response, the city passed an ordinance requiring that all petcoke shipments be enclosed and that companies must take measures to limit the spread of petcoke. Rather than the build the facilities to enclose the petcoke, BP has opted to simply send the petcoke elsewhere.

Petcoke is still a problem in Chicago as it still can get shipped through the city limits. The city has capped the amount of petcoke that can move through the city at any one time, but the Coalition wants to get that number to zero. The coalition urges people to call 311 and to tell elected officials that the only acceptable amount of put through for petcoke is zero. The Coalition will be continuing their work with Public Lab – which recently received a grant to conduct additional air quality monitoring.

In addition, if you see petcoke the City urges you to report it to 311.

For more ways to get involved, you can check out the environmental breakout group at OpenGov Hack Night.


Design for America at OpenGov Hack Night

DfA_Grey_Logo_400x400Design for America is an award-winning nationwide network of interdisciplinary student teams and community members using design to create local and social impact. Design for America teaches human centered design to young adults and collaborating community partners through extra-curricular, university based, student led design studios to look locally, create fervently and act fearlessly.
Rob Calvey and Julian Bongiorno from Design for America stopped by OpenGov Hack Night to talk about their partnership with MIT to use data and empathy to streamline the process of connecting homeless shelters with excess capacity to those who need a place to stay.

Here’s their talk:

Design for America is housed at Northwestern University and is the home to their flagship studio. They recently partnered with the Center for Neighborhood Technologies and Floodlothian Midlothian to host a panel discussion on urban flooding.

If you want to get involved, you can visit Design for America’s site. You should also check out the Civic Design Camp in April!

KIPP New Jersey Talks School Data at OpenGov Hack Night

kipp-new-jersey-sq110At this week’s OpenGov Hack Night, Andrew Martin and Juan Pablo-Valez from KIPP New Jersey spoke about the usage of data in schools.
KIPP New Jersey operates nine charter schools in New Jersey and is part of a national network that includes four schools in Chicago.

The talk was described as an anatomy lesson in school data. The entire talk is posted here:

Here are some points as well as some pointers to relevant data in Chicago.

The School Information System (SIS) and the information they hold

A School Information System is a software platform that allows school districts to manage student data. School districts also use these systems to report information about enrollment, student performance, and other information back to their authorizing authorities. This system also holds personal information about each student such as their name, grades, and what classes they’re enrolled in.  This information is heavily protected by rules and it can make getting data from schools difficult because of the need to protect student privacy.

Data researchers, such as those inside the Office of Accountability at Chicago Public Schools, use the data to answer questions regarding school population. Chicago Public Schools information to make decisions about where resources and funding should go, and about what types of supports to provide to teachers.

Schools also collect information on behavioral issues so that they can track disciplinary infractions and their outcomes.

The grade book and the challenge of comparing students to students 

Martin also spoke about the difficulties of comparing students across the board. It’s relatively simple to aggregate data from all the gradebooks in one grade and determine their average GPA. It’s much more difficult to try and compare students from different schools – particularly if they’re in different states.

With the No Child Left Behind Act, all states must develop assessments (standardized testing) at select grade levels to receive federal funding. In Illinois, the current test is called the ISAT test – but the state is now moving to to PARCC test.

Because each state test is different, it can also be difficult to compare one state test to another. Because of this, a ‘Common Core’ set of standards were put in place by forty states – including Illinois – to provide guidance on what students are expected to learn.

Another way of evaluating outcomes are college admission exams like the ACT and SAT. However, those tests are administered fairly late in a students career when it can be too late to take any corrective action.

Education Apps 

The presenters also talked about the proliferation of ed tech apps like Khan Academy. There are a number of civic startups centered around education in Chicago including several from the Impact Engine accelerator program. The presenters also pointed out that it’s sometimes easier to track a student activities as they play games.

Here’s some education data in Chicago  

  • Illinois State Board of Education School Report Card Site: An interactive site that includes test scores and other factors.
  • Illinois State Board of Education School Research Site
  • School Report Cards from Chicago Public Schools
  • Chicago Public Schools Data page
  • Schoolcuts.org: Comprehensive information on schools that closed or received students from closing schools.
  • University of Chicago Urban Education Institute: The mission of the University of Chicago Urban Education Institute (UEI) is to create knowledge to produce reliably excellent urban schooling.


Divvy Announces 2015 Divvy Data Challenge

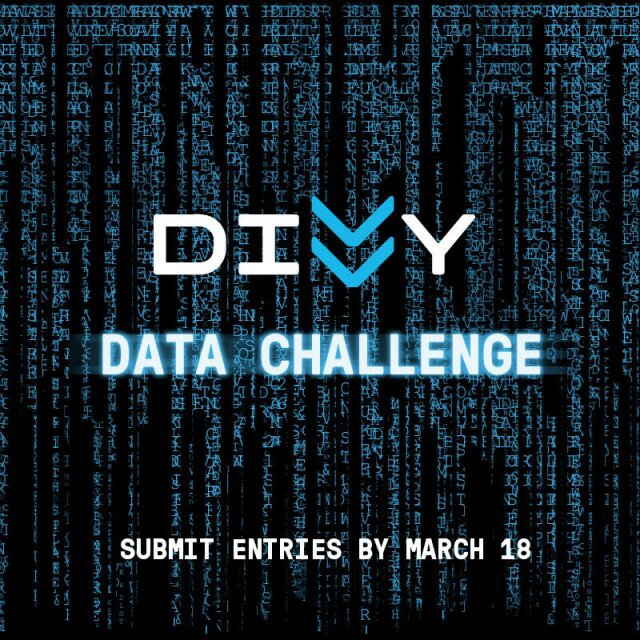
divvydatachallengeAt the last OpenGov Hack Night, Divvy announced the 2015 Divvy Data Challenge to celebrate a whole year’s worth of data becoming available. This is the second year that Divvy has issued a data challenge. Last year’s winner’s ranged from apps that chimed to the frequency of somebody checking out a Divvy bike to apps that helped single people meet other single people who ride Divvy.

Elliot Greenberger from Divvy stopped by to explain about the challenge.

Here’s the details from the contest from Divvy’s website.

JUDGING AND PRIZES

Winners will be selected for each of the following categories:

  • Best Overall Visualization:the entry that has the best overall aesthetics, provides insight, creatively illustrates the data, and is easy to understand.
  • Most Comprehensive:the entry that displays and shares the data most fully, while still being easy to understand.
  • Most Beautiful:the entry that is the most visually appealing in its illustration.
  • Most Creative:the entry that visualizes the data in the most new, different, and innovative way.
  • Most Insightful:the entry that reveals the most, or provides the most intelligent and surprising learnings from the trip data.

All entries will first be reviewed by a panel of Divvy judges, then narrowed down to a group of finalists. These finalist entries will be hosted on RedEyeChicago.com, where the public can cast a vote for their favorite visualizations.

Winning entries in each category will receive:

  • A software and hardware package from Microsoft
  • Your entry featured in a full-page ad in RedEye and on the Divvy Website
  • Gift certificates for two Divvy Memberships
  • A Divvy t-shirt and five 24-Hour Passes to share with friends and family

You can download the data as a zip file by clicking this link. Challenge submissions are due March 18th.

If you’re interested in getting a jump start on the challenge, you should attend the OpenGov Hack Night which will have a breakout group specifically about the Divvy Data Challenge.