OpenGov Hack Night: News Challenge Submissions and Mote.0.Bike

This is a weekly feature that will highlight what’s happening at the Chicago OpenGov Hack Night. The Chicago OpenGov Hack Nights are weekly events where technologists and community members come together to work with open data and build tools that improve the civic experience. The events are held at 6:00 pm each Tuesday at 1871.

This week’s first presentation: Knight News Challenge Submissions
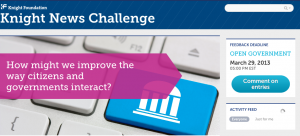
newschallenge

The deadline for submissions for the Knight News Challenge was on Monday. Civic innovators are competing for their share of $5 million dollars that the Knight Foundation will be awarding to projects that help improve the way that citizens get information from their government. (Author’s note: Smart Chicago Collaborative Executive Director Dan O’Neil is on of the readers giving feedback for the Knight Foundation News Challenge. Projects were included in the post solely because they were presented at the hack night and for no other reason.)

Projects who presented at the OpenGov Hack Night included:

Schoolcuts.org / SchoolCircle.org: (4:34)

Their Knight News Entry: SchoolCircle.org engages parents, teachers, students, & community members with data visualizations about their schools made with a combination of publicly available and crowdsourced data. Users will be able to discuss, and advocate for, their school.

Chicago Crash Browser: (5:40)

Their Knight News Entry: Chicago Crash Browser is a new tool needed by planners and engineers to analyze where the Chicago should invest in infrastructure upgrades to eliminate traffic fatalities by 2022, and educate residents & elected officials about transportation safety.

Visible CTA (7:15)

Their Knight News Entry: To give a visual trip on all CTA routes and a bit of a walk in several directions from every stop. To connect a trip with where one could work through the Illinois Department of Employment Security and other government web sites.

Augmenting 311 Systems With Data Sourced From Social Media: (9:00)

Their Knight News Entry: Enhancing Open311 (and 311 systems in general) to accept information captured from social media outlets and filtered via machine learning and human interaction.

WeCountability (10:10)

Their Knight News Entry: WeCountability will flatten a city’s organization so that good ideas can make their ways from the people doing the day-to-day work to the people making the decisions.

Crowdsourcing Building Data: (10:44)

Their Knight News Entry: We will create a smartphone web app/website that community groups will use to share information about buildings that are abandoned or in foreclosure in order to make neighborhoods more stable, make policymaking more effective, and improve vacant building data quality through crowdsourcing.

Closed Loop (12:00)

Their Knight News Entry: A data mining tool that connects the dots between political campaign contributions, lobbying, and legislation – and detects unusual patterns for investigative journalists to look into.

Announcements:

Data Science for Social Good Fellowships (15:10)

This week’s second presentation: Mote.0.Bike (24:14)

School of the Art Institute of Chicago (SAIC) professors Doug Pancoast (Professor of Architecture) and Robb Drinkwater (Professor of Sound) dropped by the OpenGov Hack Night to discuss their project involving bike sensors.

The bike-mountable moto sensors

The bike-mountable moto sensors

“The interface reconsidered” was a collaborative course taught by Robb and Doug. They wanted to redefine interface, specifically in the context of the city.

They used an Arduino Micro-Controller combined with a GPS device to help collect data as people biked around the city. The Ardunio device is programmable and can be setup to collect a number of different data points including location, air quality, altitude, light, humidity and more.

Users can upload the data on the project website. The goal is to have multiple users all over the city collect data so that we can learn more about biking in Chicago. The project is being further by Colin Hutton and the site will see improvements over the next few weeks.

Dataset of the Week: Workforce Centers
Datasets don’t have to be big to be important. The City of Chicago has four different workforce centers. The city’s partnered with over 30 different community organizations to provide employment services.
OpenGov Hack Night: Go2School and Business License Data

This is a new weekly feature that will highlight what’s happening at the Chicago OpenGov Hack Night. TheChicago OpenGov Hack Nights are weekly events where technologists and community members come together to work with open data and build tools that improve the civic experience. The events, run by Derek Eder and Juan-Pablo Velez, are held at 6:00 pm each Tuesday at 1871. As a founding member of 1871, the Smart Chicago Collaborative is proud to be able to provide space for this each week. 

This Week’s Presentation: GoToSchool by Tom Kompare

This week’s presentation is from Tom Kompare and his current app-in-progress GoToSchool. The app is help parents find directions to their kids school during those first few chaotic weeks. Tom is currently building the app hoping to have it released by the start of the next school year.

To use it, simply find your school by typing in the search bar. The app will try and help you by pulling up matching schools as you search. Once you select your school, you can state when you want to be there. Do you need to grab your kids after work? Plan for tomorrow morning? After you state when you need to be there, the app gives you three options on how you want to get there: walking, CTA/Metra, or by driving. It even gives you the number to call in case your kid is sick and can’t be at school.

The app is hosted on the Smart Chicago Collaborative servers and will be one of the first apps taking part in Civic User Testing.

Here’s how it works:

  • The site also uses Twitter bootstrap to make building the appearance of the app easier.
  • Tom used two separate data sets from CPS and placed those into Google Fusion Tables. The first is the school schedule and the second is school location data.
  • Transit directions are delivered through the Google Places API

Current Issues:

The app is still in development and has a couple of issues.

  • The data for start and end times for charter schools in incomplete
  • The “What time do you want to arrive” doesn’t look as good in Internet Explorer

Civic Developers and Designers! You Can Help Improve this app!

  • You can check out the app and submit pull request on the apps’ GitHub repository.

Dataset of the Week: Business License Data

This weeks’ dataset of the week is business license data. See that new construction across from your work? You can use the city’s business license data to pull up information on what is going into it. The city’s also built views that sort the data into different categories. For example, they have a view of the data that filters out everything but liquor licenses. You can turn that view into a heat map that where they are.

Socrata has a number of features that make exploring and viewing data easier. Once you register with the data.cityofchicago.org site you can make your own views and save them for later use.

Join us!

Are you interested in open data and civic innovation? Have something cool you’d like to show us? Register for the next OpenGov Hack Night here!

OpenGov Hack Night: IDES and Sunlight Foundation

Here’s this week’s recap of OpenGov Hack Night Chicago:

This week we live streamed the presentations due to the weather and the CTA Brown line trains not running through the loop.

This week’s first presentation: The Illinois Department of Employment Security and IllinoisJobsLink.com

Gideon Blustein from the Illinois Department of Employment Security dropped by the OpenGov Hack night to talk about employment data available on IllinoisJobLink. IllinoisJobLink is the State of Illinois’ job board designed to help match employers and job seekers.

The Illinois Employment of Employment Security publishes real time labor market information on hiring trends, salary trends, job seeker characteristics, and current labor availability.

The department is currently open to releasing data in new ways or new reports if possible. Currently, the department also released a limited number of reports on the state’s data portal.

People who are interested in working with this kind of data are encouraged to attend our open gov hack nights.

This week’s second presentation: The Sunlight Foundation and local government transparency

The Sunlight Foundation is a non-profit non-partisan organization dedicated to making government more transparent. Previously, the Sunlight Foundation mainly focused on federal transparency. This resulted in reports on government spending, APIs that help automate reports on government spending, lobbying funds, and congressional action, as well as cool apps like Inbox Influence, Scout, and other transparency tools.
This year, the Sunlight Foundation received a $2.1 million dollar grant from Google.org to help fund transparecy efforts at the municipal level.

In order to get a better idea on how this can be accomplished, the Sunlight Foundation is visiting Chicago and other cities to see what work has been done in this area locally.

Part of this work includes building a living document of open data policy guidelines. This Sunlight Foundation would like to see the open data community get involved in helping to craft these guidelines. Where do we need to expand these guidelines? Where do we need case studies? What fits and what doesn’t? What do you need to work better?

If you’re interested in helping Sunlight with this effort, feel free email the Sunlight Foundation at [email protected].

Next week’s OpenGov Hack Night will be March 12th at 6:00pm at 1871 Chicago. You can RSVP here.

OpenGov Hack Night: VA Records, OpenStreetMap, and Chicago’s data on GitHub

Here’s a recap of OpenGov Hack Night. 

This week’s presentation: Gravitytank wins the White House Health Design Challenge

Gravitytank, a consultancy firm located here in Chicago, recently won the White House Health Design Challenge. The challenge was to help redesign health records from the Veterans Administration.

As part of the VA’s Blue Button program, people under VA care can download their records at any time. However, currently these records look something like this:

The records are not exactly easy to read. So, the White House issued a challenge for people to re-imagine these records in a way that makes it easier for patients to manage their health. Gravitytank took up the challenge and came up with this design.

The design places static information such as name and birthdate on the left hand side of the screen. On the right, the information is dynamic and updates with information when to take medications, doctor’s appointments and test results.

The design also makes records more understandable. When test results come in, a sliding scale displays next to that ranges between “Concerning to Doing Well” so that the patient doesn’t have to ask the obvious “Is that good or bad?” question.

You can check out Gravitytank’s full design by clicking here.

Project of the Week: OpenStreetMap

OpenStreetMap is an open source map that anyone can use and contribute to at no cost. In Chicago, transportation guru Steve Vance and the OpenStreetMap Chicago Meetup group are working to improve the map around Chicago. Currently, Chicago’s map lags behind other cities. This includes filling in the building footprints, adding information for bikers, and helping to fill in information on Chicago’s west side.

OpenStreetMap is different from maps like Google and Bing because it has no restrictions on how you can use the data. Google has started to charge the most active websites for the use of their maps, but this won’t be a problem for OpenStreetMap. The popular app Foursqaure already uses OpenStreetMap as part of their app.

The only problem with OpenStreetMap is that Chicago’s data portal always held the right to revoke their data. If this happened, OpenStreetMap would have to delete Chicago’s data from the map. OpenStreetMap actually stopped importing data because of this issue. Which brings us to this week’s Data Set Of the Week!

Data Sets of the Week: The City of Chicago releases datasets on GitHub under the MIT license

The City of Chicago’s Director of Analytics Tom Schenk Jr.  announced that the City is now publishing some of their data sets on the city’s GitHub account under the MIT license.

Currently the city’s data portal uses a license that says that the city can revoke access to the data at anytime. Most of the time, this only gets used when there’s a mistake in the data that needs to be corrected. Once the city corrects the data set, the city releases the data on the data portal again.

However, this license limits certain open data activities like OpenStreetMap. So, the city is now releasing datasets on GitHub under the MIT license. GitHub is a website that hosts repositories of code and data that are open to the public and free for anyone to download and copy. The MIT license would enable people to continue to use the data set even if the city revokes access on the main data portal.

Eventually, the city wants to be able to accept pull requests for it’s data. A pull request is a method used on the GitHub platform that allows users to make changes to a project. For example, the city has a data set of all the bike racks. If a business owner installs their own bike rack, the city may not be aware of it and wouldn’t know to put it in the dataset. A resident could update the data and then ask the city to “pull” the updated changes into the official data set.

Next Week:

Next Tuesday, there will be no Open Gov Hack Night. Instead, the next Chicago OpenGov Meeting will feature Knight Foundation News Innovation director John Bracken who will be discussing the challenge. Because of high interest in the event, Smart Chicago will be live streaming the talks on Google+ and will post the video to YouTube. The next OpenGov Hack Night will be March 3rd.