GeoGit & GeoGinger: GitHub for Catrographers

At last week’s OpenGov Hack Night, Nick Dorian spoke about GeoGit and GeoGinger and how they can help with the process of making maps.

Untitled

One of the issues with GitHub is that it’s not a great tool for tracking changes in maps.

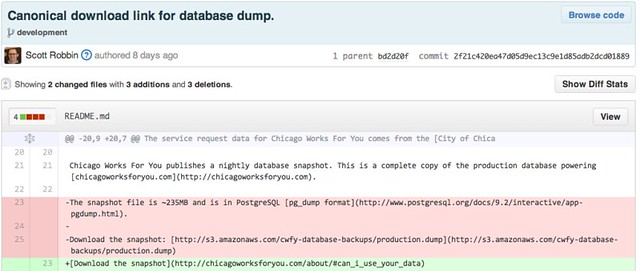
GitHub has a great feature that will show the differences in changes in a repository. For example:

githubdiff

You can see in red what has been deleted and the green text shows what was added for this particular commit. However, when changing arounds map data – the difference looks like this:

geodiff

Image Courtesy Nick Dorian

It doesn’t really show the changes that were made in a way that anyone can understand.

Using GeoGit, you can easily keep track of the differences in geographic data from one commit to another.

Nick explains how it works here:

While GeoGit helped to identify changes in geographic data, there wasn’t an easy way to push this information back into GitHub. So, over the summer Dorian built GeoGinger as a way to bridge GeoGit and GitHub. Here’s Nick explaining GeoGinter:

Both GeoGit and GeoGinger are open source projects that can be found on GitHub.


OpenGovChicago Meetup: Open Data, Chicago, and the Return EveryBlock

Tonight, we will be hosting the OpenGovChicago meetup, Open Data, Chicago, and EveryBlock  at the Chicago Community Trust. If you have questions for the speakers, enter them here in this document and come back to this post at 6PM CST for a Google Live Hangout. Questions? Daniel X. O’Neil, [email protected].

Here’s info on speakers:

Paul Wright: Director, Local Media Development, Comcast. Paul is the day-to-day leader of EveryBlock and has led the relaunch efforts. He’ll talk about the relaunch and how it got done.

Sheila Willard: SVP Local Media Development, Comcast. Sheila leads the unit under which EveryBlock is being managed. Sheila will talk about the importance of EveryBlock to Comcast.

Matt Summy: Regional Vice President, External & Government Affairs, Comcast Greater Chicago Region. Matt has worked closely with the EveryBlock team to relaunch in its hometown. He’ll talk about his role in bringing EveryBlock back to Chicago.

opengovchicago-logo-meetupThis meetup is filling to capacity very quickly, and we expect the Hangout to be very popular. The livestream will occur right in this blog post on the night of the event.

If you are signed up for the event, please be sure to keep your RSVP status updated– if something changes, please change your status so someone from the waitlist can be automatically added.

If you are interested in this event, it’s very important that you sign up on Meetup and join the OpenGovChicago group, This will ensure that you get communications about this and other topical events.

Meantime,  use this document for your questions for our speakers.

With these tools, and robust communication among us before and after the event, we hope to make remote participation as meaningful as in-person.

Let’s do this.

CUTGroup #6: OpenStreetMap Editor

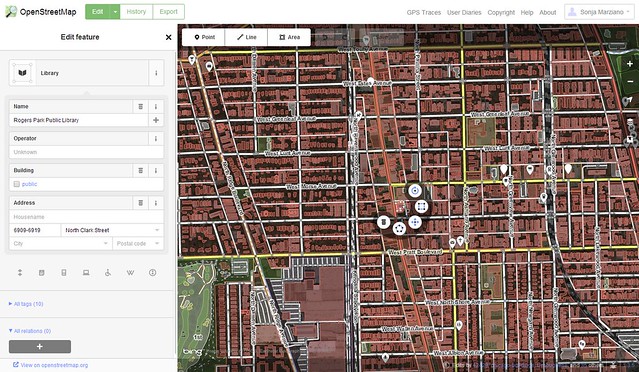
For our sixth Civic User Testing Group  session, we focused on the editor feature of OpenStreetMap.org. This in-person test took place at one of the Connect Chicago locations – Chicago Public Library Rogers Park Branch at 6907 N. Clark Street in the Rogers Park neighborhood.
CUTGroup-6-OpenStreetMap-Editor-Screen-shot-01.29.14

OpenStreetMap (OSM) is a Web site that is built by a community of mappers that contribute local knowledge and information to a map for everyone to use. Anyone can sign up, add information and edit the map.

OpenStreetMap is open data, and you are free to use it for any purpose as long as you credit OpenStreetMap and it’s contributors.

We were interested in answers to these questions:

  • How do users use the site, and what can be improved from an UX standpoint?
  • Why does the general audience want (or not want) to use the OSM editor?
  • Do people see themselves as potential long-term users?
  • Is this useful to general internet users? Do general internet users want to contribute? If so, how?

Segmenting

On January 13, 2014, we sent out an e-mail to 551 CUTGroup participants, who want to participate in-person, asking them if they would be willing to test a mapping Web site on January 22. We asked some screening questions to gather extra information, and chose our group of participants based on a diverse selection of answers.

We were interested in having  about 15 participants from different Chicago neighborhoods. Testers ended up coming from neighborhoods across Chicago including Rogers Park, Pullman, Albany Park, West Town, Logan Square, South Chicago, and more.

View CUTGroup 6 Participants in a full screen map

We ended up having 16 participants, and for 15 of these testers this was their first CUTGroup test. One tester traveled 23.45 miles from their home to participate in this test.

Results

16 testers provided their feedback regarding OpenStreetMap, and we learned a lot not only about the functionality of the map editor, but also about people’s feelings on the concept of editing a map. Some testers liked the idea of contributing knowledge for others to use, while other testers thought the concept of making live changes to a map was “scary” or “dangerous.” Here are a couple of very telling comments we got:

“I believe in power of people and having a significant contribution to these things. Gives a sense of community and add value in the sense of belonging” – Tester #5, kirehernan

“I personally would but I would not want others to have the same access as I would due to the lack of restrictions.” – Tester #7, B

How do users use the site, and what can be improved from an UX standpoint?

Walkthrough:

  • We learned that providing information through a walkthrough and the welcome page are important for users to understand how to map
  • 5 testers (31%) were never prompted to do the walkthrough or the walkthrough would not load
  • Out of the 11 testers who did at least some of the walkthrough, only 5 had positive experiences. 6 testers thought some parts were difficult or confusing

Here are some suggestions we learned:

  • It is important that users have an easy access point to the walkthrough. Instead of having the walkthrough prompt being based on what the user clicks, the walkthrough option needs to be always accessible by the user. This will allow users to access information when they want and go back to it if they need more assistance
  • Some walkthroughs did not work properly: difficulty creating a line, highlighted areas did not line up correctly, “zoom in to start mapping” was difficult to see
  • It might be helpful to consider breaking up the walkthrough into different steps. This will allow users to choose what they want to learn and serve their needs better for the type of information they want to add (ex: add a path, add an area, add information, add a note, etc)
  • 2 testers thought that a video might be easier alternative to follow

Search Function:

  • 11 testers (69%) liked the search feature, while 5 testers (31%) did not like the search function
  • Testers became frustrated that when their search was not in the visible map area that they had to choose “Search Worldwide” 
  • When searching, testers received sometimes too many options that were irrelevant to what they were looking for, or could not find their search term. Testers are interested in having a clearer way of searching for locations. Additionally, it would be helpful to understand why some results may not appear, and provide a prompt for the user to add/edit information

Editor:

  • 8 testers mentioned some difficulty in editing the map. Difficulties were in (1) search feature – some testers could not find what they were looking for, (2) finding or choosing the correct identifying tag, and (3) some thought editing was confusing. Out of these 8 testers, 5 said that they finished the walkthrough
  • 12 testers (75%) liked the edit features, while 4 testers (25%) said they did not like the editor features

Why does the general audience want (or not want) to use the OSM editor?

14 testers (88%) said they liked the Web site, and 11 testers (69%) said they would use the map editor again. Here are some reasons why testers want to use OSM editor:

  • Update outdated data
  • Contribute to a neighborhood’s visibility
  • Feel the need to customize or make a map more personal
  • Add information about safe pedestrian and bike paths

In addition, two testers mentioned that they wanted OSM to have a feature to see the history of a location to know what it used to be and what it is now.

A couple of testers do not feel like they would want to edit because they believe that maps should accurate in the first place, and that is the responsibility of the map-maker.

Do people see themselves as potential long-term users?

Testers seemed interested in adding information to locations that were important to them, or updating outdated information. This would happen on a case-by-case basis, and therefore, it might be hard to tell if testers see themselves as long-term users. Testers were not interested in mapping outside of their own realm of knowledge.

Is this useful to general internet users? Do general internet users want to contribute? If so, how?

At this time, OSM editor is a series of tools that might be difficult for some users to use. That being said, this test has informed us that most people do want to contribute, but in different ways. Some testers want to update text information, others want to add paths, and others might want to add a note.

The note feature might be more successful as a more prominent option for users. Here is a comment from a tester about the welcome page:

“Good overview. I’m curious about editing vs just adding a note. Why one over the other? Are they substantially different?” –Tester #15, Snarky

Conclusion

When testers were asked about things they noticed on the homepage, only 1 tester mentioned the “Start Mapping” button. Since testers are interested in contributing knowledge through the editor in different ways, there needs to be different points of engagement for users. OSM might want to consider prompting users to add information in different ways throughout the experience. In addition, the suite of editor features might be cumbersome for the general audience, and different levels of editing will serve a larger audience.

Final Report

Here is a final report of the results with the key highlights from our CUTGroup test, followed by each tester’s responses, and copies of our e-mail campaigns and the questions we asked:

The raw test data below with complete answers from every tester:

Here are videos from two testers:


Excerpt, Beyond Transparency, Building a Smarter Chicago: Enlightened Self-Interest Meets the Movement

For the next few Tuesdays, we are excerpting sections from Beyond Transparency: Open Data and the Future of Civic Innovation“, an anthology edited by Brett Goldstein with Lauren Dyson and published by Code for America.

I wrote a chapter titled, “Building a Smarter Chicago“, which I call “an illustrative, incomplete, and idiosyncratic look at the ecosystem in Chicago. It is meant to provide a thumbnail take on how the ecosystem developed here, while sparking fires elsewhere”. Here’s the second section, which covers the movement toward policy:

Policy: Enlightened Self-Interest Meets the Movement

As a co-founder of EveryBlock, I spent four years (2007 to 2011) working with sixteen municipalities on publishing data. I saw some fundamental patterns of open data policy development that held true here in Chicago.

First off, I can’t emphasize the power of examples enough. In December 2007, I was part of a meeting of open data advocates in Sebastopol, California. The mission was “to develop a more robust understanding of why open government data is essential to democracy.”

The output was the “8 Principles of Open Government Data” (Open Government Working Group, 2007). This simple document was a powerful, unimpeachable tool that I used every time I worked with government. It made a significant difference because it gave government-based open data advocates something to point to when they were in their internal meetings. This support of isolated pockets of policymakers was one important pattern I saw here in Chicago as well. Building relationships with public, sharable resources, like the “8 Principles,” allowed for shared trust and shared work. This pattern of template sharing is something that works.

There were nascent open data plans and products in the Daley administration, including Chicago Works For You, a project I worked on as a consultant for the City in 2005. Micah Sifry discussed this project in a 2009 article titled “A See-Through Society”:

People are eager for access to information, and public officials who try to stand in the way will discover that the internet responds to information suppression by routing around the problem. Consider the story of a site you’ve never seen, ChicagoWorksForYou.com. In June 2005, a team of Web developers working for the City of Chicago began developing a site that would take the fifty-five different kinds of service requests that flow into the city’s 311 database—items like pothole repairs, tree-trimming, garbage-can placement, building permits, and restaurant inspections—and enable users to search by address and “map what’s happening in your neighborhood.” The idea was to showcase city services at the local level. (Sifry, 2009)

Early failures often lead the way to the next policy win—that’s another pattern.

Hot topics that receive public attention are fecund areas for open data policy. In Chicago, Tax Increment Financing is a big topic, mainly because it has been an opaque financial instrument, handling huge amounts of money with very little public information about how the system works.

It’s no accident that a number of Aldermen sponsored the TIF Sunshine Ordinance in 2009 (Brooks & O’Neil, 2009). Pressure and heat get results.

The last pattern has perhaps led to the most good: when the chief executive of a unit of government wants to make a big push. Mayor Michael Bloomberg of New York won an unusual third term at the same time he pushed for BigApps; San Francisco Mayor Gavin Newsom was planning a run for governor at the same time he worked to open DataSF; and our own Mayor Rahm Emanuel embraced open data when he made a move from the White House to Chicago City Hall.

This is the pattern of powerful, enlightened elected officials in the executive branch deciding that open data is good policy. They back this up by empowering people, like former Chicago CIO Brett Goldstein and CTO John Tolva, to develop and implement that policy.

It’s the unique and aggressive policy of publishing data that has brought the movement further here in Chicago.

Hack Dash + opengovhacknight.org: Making it easier to get involved

One of the challenges in organizing volunteers around building civic web applications is that there are a lot of people with a lot of different skills and many projects to choose from – particularly in Chicago.

This weeks projects #civichacking

Over the past few weeks, Derek Eder, Forest Gregg,  Eric van Zanten and others have been building opengovhacknight.org to help aggragate information on civic innovation projects in Chicago. Now, with the addition of Hack Dash – it just became much easier for people to get involved in civic hacking!

Continue reading