Tonight Sonja Marziano presented at The Chicago Community Trust President & CEO Terry Mazany’s Special Topics: Social Enterprise class at Northwestern University. Here’s what we showed:
Month: February 2015
Crime, Data, Justice
I have worked worked with a lot of crime data from a lot of cities, going back almost 10 years. I’ve worked with hundreds of colleagues to get more crime data published, make apps based on crime data, and to improve standards around the publication of crime data.
Today’s story in The Guardian, (The disappeared: Chicago police detain Americans at abuse-laden ‘black site’) is a blockbuster piece of journalism that signals a very important day for those of us who care about this work. Here’s an extended snip:
The Chicago police department operates an off-the-books interrogation compound, rendering Americans unable to be found by family or attorneys while locked inside what lawyers say is the domestic equivalent of a CIA black site.
The facility, a nondescript warehouse on Chicago’s west side known as Homan Square, has long been the scene of secretive work by special police units. Interviews with local attorneys and one protester who spent the better part of a day shackled in Homan Square describe operations that deny access to basic constitutional rights.
Alleged police practices at Homan Square, according to those familiar with the facility who spoke out to the Guardian after its investigation into Chicago police abuse, include:
- Keeping arrestees out of official booking databases
- Beating by police, resulting in head wounds.
- Shackling for prolonged periods.
- Denying attorneys access to the “secure” facility.
- Holding people without legal counsel for between 12 and 24 hours, including people as young as 15.
A day like this makes me proud of what we do and the way we do it.
At Smart Chicago, we’ve never made a crime report app. In our Justice program, we focus on access to data (not just display), youth-led tech (rather than data-driven apps), and websites that delve into published and unpublished datasets about incarceration (so that we can go beyond the data handed down and try to see what’s still left behind).
I’m particularly proud of two justice-centered technology projects we’ve published over the last year, with our partners the Chicago Justice Project and FreeGeek Chicago’s Supreme Chi-Town Coding Crew. I think these projects are exemplary apps in a post-Homan Square civic tech world.
They don’t display official crime data. Instead, Crime and Punishment in Chicago focuses (like the Guardian story) on what *isn’t* published.
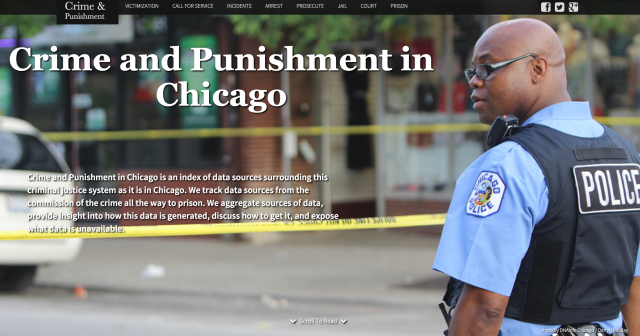
Here’s our description:
All over Chicago, every day, in every corner of our oblong city, people commit crimes. This project is an index of the data that documents these crimes and what, if any, response there is from the criminal justice system.
The documentation is immense. Some is published. Much of it is not. Our goal is to create a flat, simple guide to what is known and what is not.
We haven’t waited for data to hit the data portal— we work with hard-nosed people like Tracy Siska who get a hold of never-before-published conviction data through FOIA. This data is displayed in Convicted in Cook.
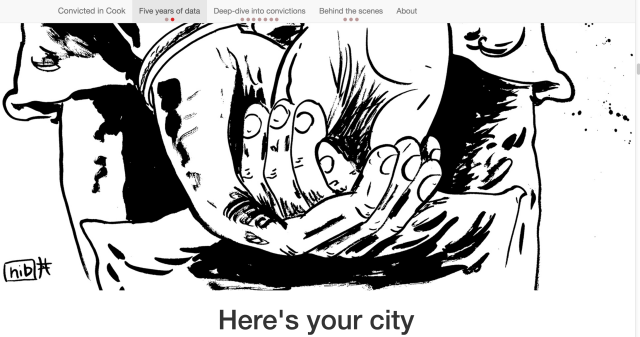
Here’s our description:
This project is an analysis of five years of Cook County conviction data. The information was received by Tracy Siska of the Chicago Justice Project from the Office of the Chief Judge of the Circuit Court of Cook County through a request to the chief judge. We’ve posted a copy of that request here.
Each year, tens of thousands of people stand in front of judges at the Cook County Circuit Court, the largest unified court system in the country. Their offenses range from marijuana possession charges that result in low-level misdemeanor convictions to multiple murders that put people behind bars for life.
When a violent crime is picked up by the news media, it’s often sensationalised so that every minor detail is brought into the public purview. Meanwhile, the vast majority of convictions – mostly drug related – are given little notice.
This project will attempt to answer several questions regarding convictions in Cook County. Upon first receiving the data, it became apparent that the data was messy and incomplete.
Two projects that use technology and data to zero in on justice, not tech projects that zero in on crime data. As we’ve seen in today’s news, published an ocean away from the corner of Homan and Fillmore, the only way past messy and incomplete is more work. So: onward.
Join us at The Chicago Community Trust for Maptime Chicago!
 The Smart Chicago Collaborative is hosting Maptime Chicago next Thursday at our offices at the Chicago Community Trust (located at 225 N Michigan #2200).
Their first event at the Trust will be a primer on how web maps work. Here’s the event description:
Web maps might look like digital wizardry, but anyone armed with a few basic skills can whip up an awesome-looking web-based map. This beginner-friendly workshop will cover what makes a web map tick. We’ll discuss the technological innovations that brought us to today, the structure of common mapping strategies, and the tools you can use to put your geospatial data on the web.
Maptime is always interactive, so don’t forget to bring your laptop! As always, beginners are very welcome.
Maptime Chicago is part of a larger national organization whose mission is to open the doors of cartographic possibility to anyone interested by creating a time and space for collaborative learning, exploration, and map creation using mapping tools and technologies.
Maptime has a huge list of resources on their website for people wanting to get into map making including introductions to OpenStreetMap, D3 tutorials, QGIS, and more.
You can register for the event here. If you can’t make it in person, we’ll also be livestreaming it on our YouTube page. You can also follow Maptime Chicago on Twitter at @MaptimeChi
Toward a Municipal Ping Service
 The death of RSS (Real Simple Syndication) has made the Web less fluid. This is not a good thing. The good thing is that American cities are uniquely positioned to make a dent in this trend.
The popularity of this recent tweet by my colleague Harper Reed is a good indication of yearning for a generic subscription system for content updates:
i miss @google reader
— harper (@harper) February 8, 2015
Alongside the demise of RSS is the rise of proprietary timeline systems like Facebook and Twitter. This is a poor substitute because 1/ the systems are not universal and 2/ those systems are closed to aggregation, remixing, and analysis.
Cities can be at the center of part of a solution. 81% of people in the United States live in cities & surrounding suburbs, and this number continues to grow. This approaches some level of universality of experience, since interaction with businesses in these places make up a large percentage of the American experience. This includes every school, restaurant, coffee shop, parking spot, store. It covers nearly every review on Yelp, every check-in on Foursquare, any post of Facebook that relates to a business or organization located in a specific place.
Each municipality has rules, regulations, and processes governing the creation and maintenance of businesses. More importantly, each municipality has issued each business a unique ID (a “handle”) to which it can be referred, but never is. Whether it is a building permit, a liquor license, or a certificate of occupancy, there are amazingly detailed records on every business in every city of size.
These handles could be used as a trusted reference point for all other services. The overall repository of these numbers can then serve as a central, trusted repository for all other services to reference.
What if every review on Yelp, every Google Places page, every Facebook post that referenced a business, had this unique ID embedded in it in some way? And if all of these systems allowed for all of this disparate data to be aggregated into a complete view of the place? What if you could reference a location when making a service request? “The snow in front of Business 127 hasn’t been shoveled in three days”. Or, as a private business, you could lookup everything a city knows about a place. If it could be integrated with existing services like Open Table (“new tomatoes delivered to Restaurant 77. That means that the Fried Green Tomatoes special is on the menu”.) Unlimited.
It could be the trusted external source, not owned by any proprietary system. And it could be a platform upon which cities can start using their public data stores in more meaningful ways.
CUTGroup is an Ash Center Bright Idea 2015
 Today the Ash Center for Democratic Governance and Innovation at the John F. Kennedy School of Government, Harvard University, recognized today our CUTGroup program as part of the 2015 Bright Ideas program. Here’s their citation:
Civic User Testing Group
City of Chicago, ILThe Civic User Testing Group is a set of Chicago residents who get paid to test civic apps. Smart Chicago works with residents and civic tech developers to make and test software that helps improve quality of life for residents. Members receive training on basic technology skills, provide feedback, and perform beta-testing on apps and government websites.
Note: Smart Chicago’s Foodborne Chicago product was also recognized this year as a Top 25 Innovation in Government by the Ash Center.
Divvy Announces 2015 Divvy Data Challenge
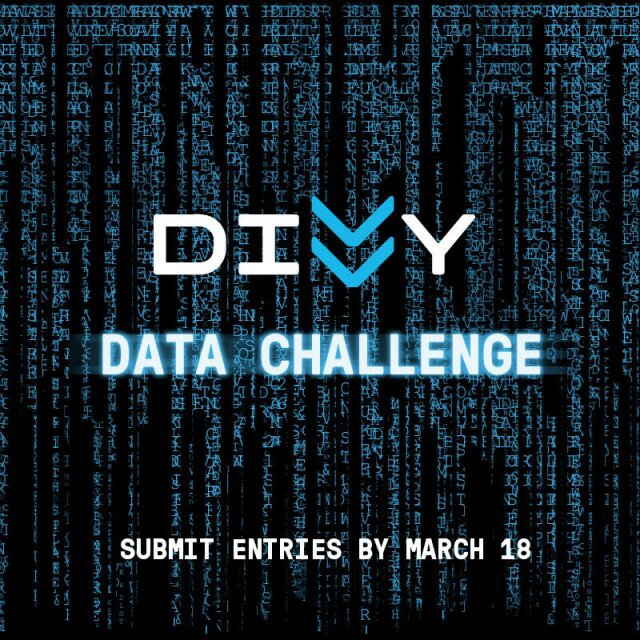 At the last OpenGov Hack Night, Divvy announced the 2015 Divvy Data Challenge to celebrate a whole year’s worth of data becoming available. This is the second year that Divvy has issued a data challenge. Last year’s winner’s ranged from apps that chimed to the frequency of somebody checking out a Divvy bike to apps that helped single people meet other single people who ride Divvy.
Elliot Greenberger from Divvy stopped by to explain about the challenge.
Here’s the details from the contest from Divvy’s website.
JUDGING AND PRIZES
Winners will be selected for each of the following categories:
- Best Overall Visualization:the entry that has the best overall aesthetics, provides insight, creatively illustrates the data, and is easy to understand.
- Most Comprehensive:the entry that displays and shares the data most fully, while still being easy to understand.
- Most Beautiful:the entry that is the most visually appealing in its illustration.
- Most Creative:the entry that visualizes the data in the most new, different, and innovative way.
- Most Insightful:the entry that reveals the most, or provides the most intelligent and surprising learnings from the trip data.
All entries will first be reviewed by a panel of Divvy judges, then narrowed down to a group of finalists. These finalist entries will be hosted on RedEyeChicago.com, where the public can cast a vote for their favorite visualizations.
Winning entries in each category will receive:
- A software and hardware package from Microsoft
- Your entry featured in a full-page ad in RedEye and on the Divvy Website
- Gift certificates for two Divvy Memberships
- A Divvy t-shirt and five 24-Hour Passes to share with friends and family
You can download the data as a zip file by clicking this link. Challenge submissions are due March 18th.
If you’re interested in getting a jump start on the challenge, you should attend the OpenGov Hack Night which will have a breakout group specifically about the Divvy Data Challenge.